This is a project long in the gestation, which I have recently returned to. It began as a pilot study funded by the University of Huddersfield timed to feed into the preparation of a keynote intervention on Victorian generations for the annual conference of the British Association for Victorian Studies in 2015. And then, despite the significance of the initial results, it largely stalled. But in the light of the rapidly intensifying interest in generational approaches which the last few years have brought it is time for the project to be revised and completed.
The project involves creating a database of articles from the Edinburgh Review, the Westminster Review, Blackwood’s Edinburgh Magazine, Fraser’s Magazine, Macmillan’s Magazine, Ainsworth’s Magazine, the London Quarterly Magazine, and The Nineteenth Century. Although this is only a selection of the periodicals indexed in the 5 volumes of the Wellesley, it represents nearly 22,000 articles, and nearly 4000 different authors spread roughly evenly across the period 1824 to 1900.
Figure 1. Generational Shares by 5-year Period
The primary focus of the Wellesley was to provide author attributions for essays frequently published anonymously, although it is often overlooked that as the practice of appending author’s names spread over the period, many of the essays included in the Index already had a basic name attribution. The Wellesley provides only limited additional information, life dates where known, and if possible some indication of occupation or identity. This makes the Index especially useful for generational explorations, where the ability to assign generationally on the basis of birth date is the key consideration. Of the original 4000 authors, about a quarter lacked a birthdate, and one focus of current work has been to fill in as many of the gaps as possible. As a result another 500 birthdates have been identified, so that at present nearly 90% of the authors in the selection can be assigned to a generation, using the schema (primarily of early, mid, high, and late Victorian, and Edwardian) that underpins the analysis in my recent study of the reception of Darwinism, Darwinism’s Generations.
Figure 2. Numbers from each generation in the selection
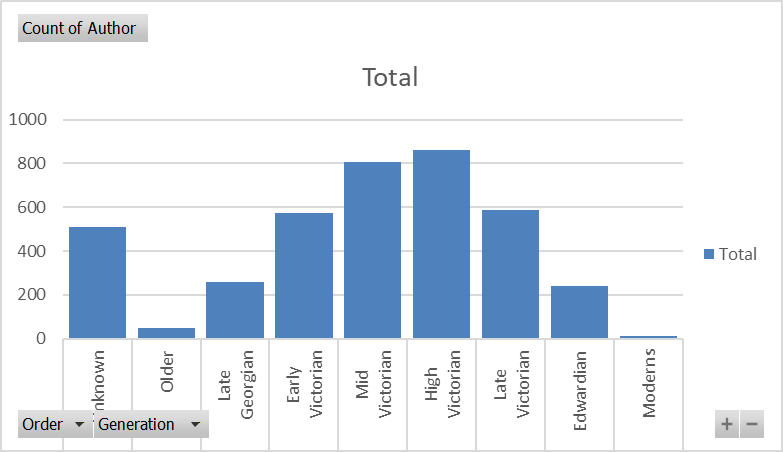
Plotting the relative contribution of each generation to the total sum of articles published in each year across the period reveals some striking patterns. As with all demographic data of this sort there are a series of rough bell curves as each generation grows to adulthood lives through maturity, and then declines in old age and ultimately dies off. And this pattern is visible in the Wellesley data. But what is striking is the way in which these curves create clear periods of predominance for the late Georgian, and early and mid Victorian generations, aligned very closely to the conventional dates of the early Victorian and mid Victorian periods; and in contrast the way the second half of the Victorian period is characterised by a much less marked predominance of the high and late Victorians, not least because the tale of the curves of the early and mid-Victorians are much longer and slower of decline than of the generations which preceded them.
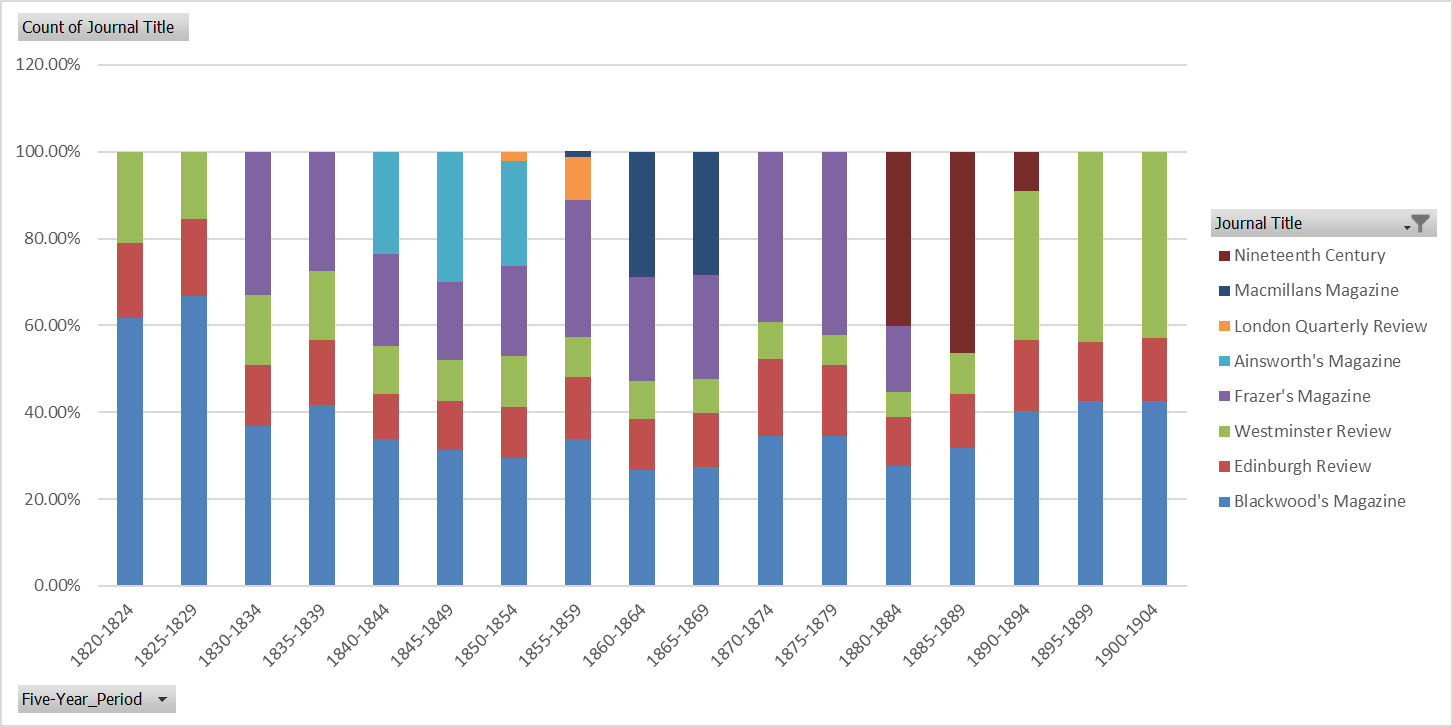
Figure 3. Generational Shares of Periodical Publications (three year rolling averages)

There is a lot to unpack here, both in terms of the patterns revealed by the graph, and the dynamics which created them. There may be a degree of distortion arising out of the particular selection of titles; the longevity of the titles included in the selection brings inertial effects: there is no doubt that data from a more obviously ‘fin de siecle’ journal would show fewer early and mid Victorians in the contents of the 1890s. Changes in proprietorship or editorial control may well have had an influence only partly mitigated by the inclusion of multiple titles for each year. And the inclusion of serial fiction or the sorts of brief interventions published by the Westminster Review in the 1880s and 1890s both also potentially skew the data. These are the sorts of questions that will be addressed, alongside a deeper dive into the implications of the shapes in the graph.
